日経平均のシミュレーションで分足を使ってみたいのですがなかなか手に入りません。いろいろ探したところ、現物は無理ですが先物なら こちら(225Labo)でダウンロードできます。
現物と先物はほぼ連動するらしいので、現物の取引時間帯(9:00~11:30、12:30~15:00)の価格を先物データから抜き出し、日経平均の替りに使ってみます。抜き出し用のプログラムは python で作ります。
- 目次 -
スポンサーリンク
ファイル
ダウンロードファイルは Excel です。一年ごとのブック になっており、1分足、5分足、10分足・・・がそれぞれシート化 されています。
現物の取引時間は2011年11月に変更になっているので、それ以降の 2012年~2016年のデータをダウンロードして使います。ファイル名は
N225f_2012.xls
N225f_2013.xls
N225f_2014.xls
N225f_2015.xls
N225f_2016.xlsx
N225f_2013.xls
N225f_2014.xls
N225f_2015.xls
N225f_2016.xlsx
です。
プログラム
使用するパッケージ
python の DataFrame を使うので、pandas が必要です。あと、プログラムには明示的に出てきませんが、Excel の読み込みで xlrd パッケージが動いているようです。未インストールの場合は
|
1 |
pip install xlrd |
でインストールしておきます。(Anaconda 環境には初めから入っているようです)
ソース
まず 1分足 の日中データを作成し、そこから 5分足、60分足、日足 のデータを作成しています。
|
1 2 3 4 5 6 7 8 9 10 11 12 13 14 15 16 17 18 19 20 21 22 23 24 25 26 27 28 29 30 31 32 33 34 35 36 37 38 39 40 41 42 43 44 45 46 47 48 49 50 51 52 53 54 55 56 57 58 59 60 61 62 63 64 65 66 67 68 69 70 71 72 73 74 75 76 77 78 79 80 81 82 83 84 85 86 87 88 89 90 91 92 93 94 95 96 97 98 99 100 101 102 103 104 |
import pandas as pd from pandas import DataFrame from collections import OrderedDict import pandas.tseries.offsets as offsets import pickle import os def read_excel(books): df = None for book, sheets in books.items(): print (book) opened_book = pd.ExcelFile(book) for sheet in sheets: print (sheet) if df is None: df = opened_book.parse(sheet) else: df = df.append(opened_book.parse(sheet)) # ブック間で一部データが重複しているので削除 (年初のデータ) df.drop_duplicates([u'日付', u'時間'], keep='last', inplace=True) # インデックス作成 df.index = df.apply(lambda x: pd.to_datetime(str(x[u'日付'].date()) + ' ' + str(x[u'時間'])), axis=1) # type(df[u'日付'][0]) # Out[26]: pandas.tslib.Timestamp # type(df[u'時間'][0]) # Out[27]: datetime.time # # 日中の取引時間 9:00 - 11:29(11:30), 12:30 - 14:59(15:00) # start_ends = [[[pd.to_datetime(d) + offsets.Hour(9), pd.to_datetime(d) + offsets.Hour(11) + offsets.Minute(29)], [pd.to_datetime(d) + offsets.Hour(12) + offsets.Minute(30), pd.to_datetime(d) + offsets.Hour(14) + offsets.Minute(59)]] for d in df[u'日付'].unique()] # # 日中のデータを取り出す # day_df = None for am, pm in start_ends: select = df[am[0] : am[1]].append(df[pm[0] : pm[1]]) if day_df is None: day_df = select else: day_df = day_df.append(select) # 日付、時間 を削除 (インデックスにしてあるので) day_df.drop([u'日付', u'時間'], axis=1, inplace=True) return day_df def get_minute_data(df, minutes): ''' n 分足を作成 ''' data_list = [] index_list = [] for i in range(len(df) / minutes): df_tmp = df.iloc[i*minutes : (i+1)*minutes] open = df_tmp.iloc[0][u'始値'] close = df_tmp.iloc[-1][u'終値'] high = max(df_tmp[u'高値']) low = min(df_tmp[u'安値']) volume = sum(df_tmp[u'出来高']) data_list.append([open, high, low, close, volume]) index_list.append(df_tmp.index[0]) return DataFrame(data_list, index=index_list, columns=[u'始値', u'高値', u'安値', u'終値', u'出来高']) if __name__ == '__main__': books = OrderedDict() books[u'株価/日経225先物(分足)/N225f_2012.xls'] = [u'1min', u'1min (2)', u'1min (3)', u'1min(4)', u'1min(5)'] books[u'株価/日経225先物(分足)/N225f_2013.xls'] = [u'1min', u'1min(2)', u'1min(3)', u'1min(4)', u'1min(5)'] books[u'株価/日経225先物(分足)/N225f_2014.xls'] = [u'1min', u'1min(2)', u'1min(3)', u'1min(4)', u'1min(5)'] books[u'株価/日経225先物(分足)/N225f_2015.xls'] = [u'1min', u'1min(2)', u'1min(3)', u'1min(4)', u'1min(5)'] books[u'株価/日経225先物(分足)/N225f_2016.xlsx'] = [u'1min'] pickle_path = u'株価/日経225先物(分足)/N225f.pickle' csv_path = u'株価/日経225先物(分足)/N225f.csv' if os.path.exists(pickle_path): minute_1_df = pickle.load(open(pickle_path, 'rb')) else: minute_1_df = read_excel(books) minute_1_df.to_pickle(pickle_path) minute_1_df.to_csv(csv_path, encoding="SHIFT-JIS") # 以下、csv の読み込み # minute_1_df = pd.read_csv(csv_path, index_col=0, encoding="SHIFT-JIS") # minute_1_df.index = pd.to_datetime(minute_1_df.index) # 5分足、60分足、日足(300分)を作る minute_5_df = get_minute_data(minute_1_df, 5) minute_60_df = get_minute_data(minute_1_df, 60) minute_300_df = get_minute_data(minute_1_df, 300) |
60分足は若干手抜きです。11:00~11:30、12:30~13:00 の合計を60分としています。
結果
実行に 30分ほどかかりました。
データのできあがりはこんな感じです。
|
1 2 3 4 5 6 7 8 9 10 11 12 13 14 15 16 17 18 19 20 21 22 23 24 25 26 27 28 29 30 31 32 33 34 35 36 37 38 39 40 41 42 43 |
# 1分足 minute_1_df[:5] #----------------------------------------------------- # 始値 高値 安値 終値 出来高 # 2012-01-04 09:00:00 8530 8550 8530 8550 4161 # 2012-01-04 09:01:00 8550 8550 8540 8550 1391 # 2012-01-04 09:02:00 8550 8560 8550 8560 1286 # 2012-01-04 09:03:00 8560 8560 8550 8560 1155 # 2012-01-04 09:04:00 8560 8570 8560 8560 88 #----------------------------------------------------- # 5分足 minute_5_df[:5] #----------------------------------------------------- # 始値 高値 安値 終値 出来高 # 2012-01-04 09:00:00 8530 8570 8530 8560 8081 # 2012-01-04 09:05:00 8560 8570 8550 8560 961 # 2012-01-04 09:10:00 8550 8560 8550 8550 48 # 2012-01-04 09:15:00 8550 8560 8550 8560 1273 # 2012-01-04 09:20:00 8570 8570 8550 8560 766 #----------------------------------------------------- # 時間足 minute_60_df[:5] #----------------------------------------------------- # 始値 高値 安値 終値 出来高 # 2012-01-04 09:00:00 8530 8570 8530 8560 13781 # 2012-01-04 10:00:00 8570 8580 8550 8550 4084 # 2012-01-04 11:00:00 8560 8570 8540 8560 3527 # 2012-01-04 13:00:00 8560 8570 8550 8560 2644 # 2012-01-04 14:00:00 8570 8580 8550 8560 6129 #----------------------------------------------------- # 日足 minute_300_df[:5] #----------------------------------------------------- # 始値 高値 安値 終値 出来高 # 2012-01-04 09:00:00 8530 8580 8530 8560 30165 # 2012-01-05 09:00:00 8500 8520 8470 8490 11878 # 2012-01-06 09:00:00 8490 8490 8340 8380 33905 # 2012-01-10 09:00:00 8400 8440 8400 8420 16178 # 2012-01-11 09:00:00 8430 8460 8420 8440 19939 #----------------------------------------------------- |
プロット
終値や出来高をプロットしてみます。
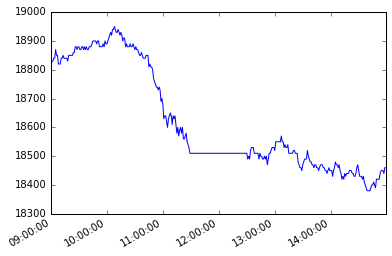
終値 1分足(2016年1月4日)
|
1 |
minute_1_df.loc['2016-01-04'][u'終値'].plot() |
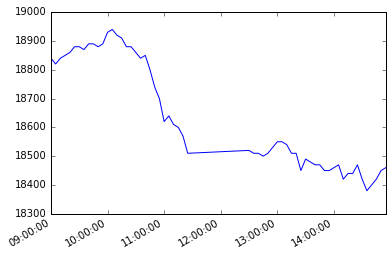
終値 5分足(2016年1月4日)
|
1 |
minute_5_df.loc['2016-01-04'][u'終値'].plot() |
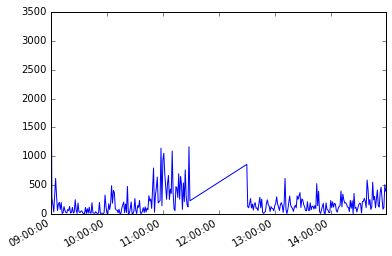
出来高 1分足(2016年1月4日)
|
1 |
minute_1_df.loc['2016-01-04'][u'出来高'].plot() |
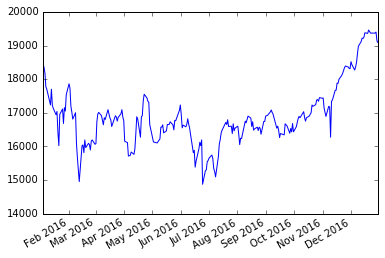
2016年の推移 日足
|
1 |
minute_300_df.loc['2016'][u'終値'].plot() |
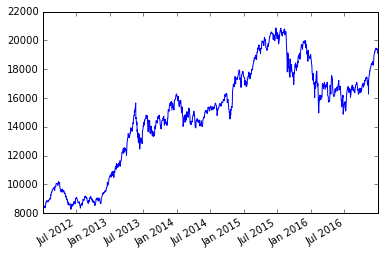
2012年から2016年の推移 日足
|
1 |
minute_300_df.loc['2012':'2016'][u'終値'].plot() |
スポンサーリンク
その他の記事
- プログラムで株価のゴールデンクロスとデッドクロスを検出
- 機械学習で株価(日経平均)を予想できず。失敗原因を考える
- selenium で yahooニュースのコメントをスクレイピング
- 政府統計 e-stat の人口推計値を読みこむ