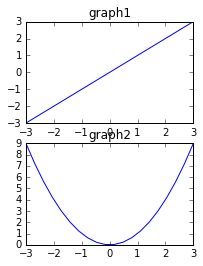
matplotlib で複数のグラフを描く場合に subplot を使いますが、グラフ間の距離が近すぎて見づらくなるケースがあります。たとえば グラフにタイトルを設定すると上下のタイトルと目盛が重なってしまい読めなくなります。
グラフ間に余白を持たせるには subplots_adjust メソッドを使います。
- 目次 -
スポンサーリンク
subplots_adjust
左右の余白は wspace、上下の余白は hspace で指定します。
(デフォルトは共に 0.2)
こんな感じ
|
1 2 |
import matplotlib.pyplot as plt plt.subplots_adjust(wspace=0.4, hspace=0.6) |
2行2列のグラフで試してみます。(ソースは後に)
before
デフォルトのまま(subplots_adjust を呼出さない)だとタイトルと目盛が重なってしまいます。
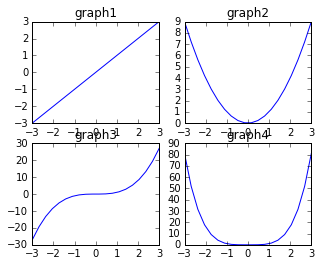
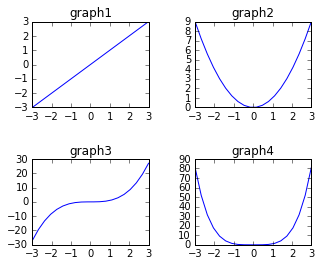
after
wspace=0.4, hspace=0.6 を指定するとこうなります。
ソース
|
1 2 3 4 5 6 7 8 9 10 11 12 13 14 15 16 17 18 19 20 21 22 23 24 25 26 27 28 29 30 31 32 33 34 35 |
import numpy as np import matplotlib.pyplot as plt x = np.linspace(-3, 3, 20) y1 = x y2 = x ** 2 y3 = x ** 3 y4 = x ** 4 plt.figure(figsize=(5,4)) # 余白を設定 plt.subplots_adjust(wspace=0.4, hspace=0.6) # 左上 plt.subplot(2,2,1) plt.title('graph1') plt.plot(x, y1) # 右上 plt.subplot(2,2,2) plt.title('graph2') plt.plot(x, y2) # 左下 plt.subplot(2,2,3) plt.title('graph3') plt.plot(x, y3) # 右下 plt.subplot(2,2,4) plt.title('graph4') plt.plot(x, y4) plt.show() |
匿名 says:
hspace とwspace の説明が逆ではないかと思うのですが
管理人 says:
お、なんと
ご指摘ありがとうございます。
直しました。